You are missing out on profits and customer engagement if you ignore your data. Yes, data is the most essential part of any business. You may not trust us, but trust this research that shows that the data industry has grown from $169 billion in 2018 to $348.21 billion in 2024. The growth will continue in 2025. With the new year approaching, we are here to help you enhance your business to boost growth and sales. So, we discussed the benefits of data visualizaiton and how you can implement it to increase your business growth in 2025!
What is data visualization for businesses?
Data visualization uses visual tools like graphs, charts, and more to represent your data. It helps us understand and interpret the data to identify trends, growth opportunities, and problem areas. It is widely used because it allows us to analyze and understand the spreadsheet, which might give you a headache if analyzed manually. Whether tracking operations, managing resources and finances, or analyzing marketing strategy performance, data visualization makes the task more accessible and more understandable for all (from head executives to team members).
Let’s talk about the most important benefits of data visualization for businesses in 2025!
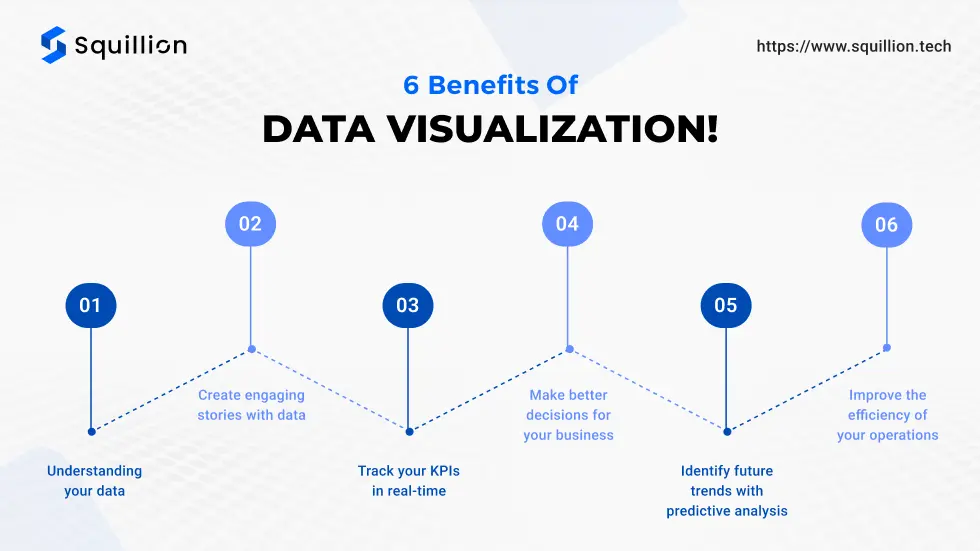
6 benefits of data visualization!
Businesses need to operate in a competitive market. That’s why the data becomes crucial for their growth strategy. It helps businesses identify their strengths and weaknesses in the company’s internal and external environment. Let’s understand more about it.
Understanding your data
As discussed above, understanding your data is essential for your growth. However, it is crucial to know that when we say ‘data’, we mean internal and external data. What’s that? It is understanding what’s happening inside your company (Resource utilization and team performance) and outside your company (Market trends, customer satisfaction, and competition). Understanding these data is a must if you want your business to succeed and earn more profits.
For example, by understanding your customer’s behaviour, you can identify their needs and pain points to enhance your offerings. On the other hand, tracking the production flow can help you identify any faulty area or time-consuming procedure to improve your operations and save resources.
Create engaging stories with data
Let’s be real; we all have yawned, looking at a boring presentation at some point. However, the viewer will be engaged when you show the same presentation with colourful charts to create a visual story. That’s why data visualization is such a crucial tool for business. There are always rushed decisions or a shortage of time. Thus, when you convert your data into a story, it is more helpful and engaging. Everyone needs something motivating and appealing to go through a meeting on a Friday afternoon, and data visualization can make meetings interesting.
Track your KPIs in real-time
A successful business is consistently improving its operations and marketing strategies. But how do you know where you need to improve? Simple, by understanding your data regarding your team’s performance, business operations, strategies, financial records and more. First, you must select your crucial KPIs whose data you can collect. You can easily track your KPIs by using data visualization tools like Power BI.
The benefit of data visualization is that you can connect your data sources to get live updates whenever needed to make quick and efficient decisions. For example, if you want to track the sales in all your target markets to measure the performance of a product for improvement, you can do it with data visualization tools with a few clicks.
Make better decisions for your business
A business is a series of decisions for your products, marketing strategy, partnerships, funding, and more. However, making this decision is critical and needs lots of insights. That’s where data visualization comes in handy. That’s why it is found that those using data analysis witness 8% revenue growth and a 10% reduction in cost. So, one of the most important benefits of data visualization is having access to real-time data insights at your fingertips. It saves time, energy, and resources to manage your business effortlessly by making data-backed decisions.
Identify future trends with predictive analysis
Intelligent businesses stay ahead of the market and take timely actions. That’s why you need to have an understanding of future trends. The future trends are based on past data analysis. Thus, predictive analysis is one of the benefits of data visualization using Microsoft Power BI Consulting Service. With the use of AI and predictive analysis, it helps draw future trends based on market trends and your KPIs performance. It enables you to prepare effective strategies to grow your business and exploit the market trends.
Improve the efficiency of your operations
Your ride to make your business successful will be smooth only if your engine is oiled well. This means the success of your business depends on how efficient your operations are. The synergy of the supply chain, resource allocation, production cycle, or team efficiency makes the business thrive. Thus, with data visualization, you can track the performance and identify the problem areas to create appropriate strategies.
For example, if you struggle to create enough products, the supply of raw materials might be an issue. Thus, with the help of data visualization, you can track the timing of the supply and the possible reason for the delay in data analysis and trend visualization. It helps you take action and make effective decisions.
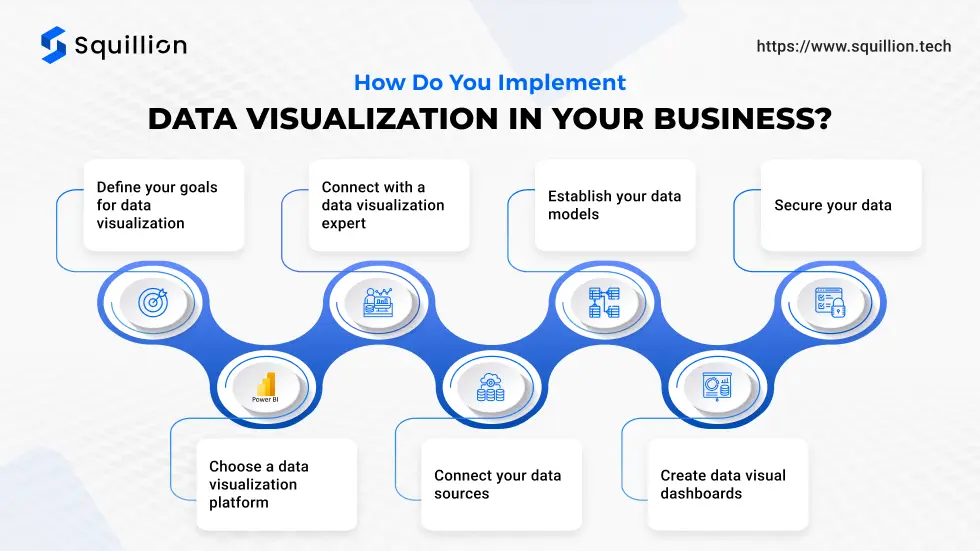
How do you implement data visualization in your business?
So, we talked about the benefits of data visualization. But how do you benefit of data visualizaiton to grow your business? Well, we can help! Following is a simple process to incorporate data visualization tools in your organization to boost your growth and make better decisions.
Define your goals for data visualization
The first step is to identify what you want from the data visualization. For example, do you want to track your sales, marketing strategy performance, supply chain efficiency, operations, team performance, or other KPIs? Based on these needs, you can create a better data visualization dashboard for the viewers and help them make decisions.
Choose a data visualization platform
Now comes the most crucial part of implementing data visualization in your business: choosing a data visualization platform. Many popular business intelligence tools like Power BI, Tableau, or Google Data Studio offer data visualization services. Choose the platform based on its services, pricing, and the advanced services you might need. For example, Power BI is the industry leader because of its user-friendly interface, advanced features, and affordable pricing.
Connect with a data visualization expert
Diving into data analysis and visualization is ambitious. However, consulting with a data visualization expert can make a significant difference, especially if you’re new to data visualization. These experts, like Squillion Tech, can help you streamline your implementation by quickly creating a data visualization dashboard catering to your needs. They allow you to optimize your data setup and useful insight visuals and train your team to use the data visualiztion tools efficiently.
Connect your data sources
Have you ever cooked delicious soup with any ingredients available in your fridge? The answer is no! Similarly, you need to store data in your data visualization tool for efficient visualization. Each tool offers data integration tools to help you connect various data sources directly. For example, Power BI is a tool that enables you to integrate diverse data sources (on-premise and cloud) like CRM systems, ERP, marketing platforms, and operational databases. Power BI developers make this process swift and effortless to help you kick-start your data analysis process.
Establish your data models
Data modelling defines how data is organized and stored, making it easier for analysis. The benefits of a data visualization tool are that it has built-in data modelling features to make the process smoother and avoid any errors. Certified Power BI Service Providers create the data models per your data analysis needs and visualization goals.
Create data visual dashboards
The data visualizations are displayed on the dashboards. You can create multiple dashboards through workspaces to make it more manageable. Dashboards should be easy to navigate and tailored to each department’s needs, empowering teams to track KPIs that matter most to them.
Secure your data
Data are sensitive and should be secured. Therefore, choose a platform with the best encryption and data protection features and protocols. Ensure your data visualization platform adheres to privacy and security standards, such as GDPR or CCPA. For example, Power BI offers you role-based access to help you authenticate the users and track the access to the sensitive data.
How can Squillion Tech help you grow?
Squillion Tech is a Power BI Consulting Service company that has a Microsoft Power BI partnership. Thus, we offer dynamic Power BI services to businesses and startups of all sizes. Our certified Power BI developers team has helped us create effective solutions for customers in diverse sectors like logistics, scooter rental business, healthcare, automotive, eCommerce, SaaS, and more. Furthermore, we have launched Power BI custom visuals like ‘Map Of Squillion’, ranking among the top 50 of the Power BI visuals within 6 months of its launch. So, you get the best services and communication when you work with Squillion Tech. Contact us to learn more. We are eager to hear from you.
Conclusion
Data visualization is becoming the new normal for businesses around the globe; it is expected to grow more popularity in 2025. It helps you understand your market and business operations, make better decisions, and track your KPIs effortlessly. There are many more benefits of data visualization including drawing future trends and insights of your opreation for better ROI. You need to choose the right data visulizaiton tool and consultant to implement the data visualization system in your business hassle-free. Squillion Tech can help you with understanding your needs, creating custom data visualization solution, implement the system, and train your team to use the data visualization tool efficiently.

