Imagine having the overview of your business on one screen. With one click, you can watch all your KPIs and departmental performance. Moreover, you can measure the performance at a glance to make better decisions. Sounds convenient, doesn’t it? That’s the power of data visualization and the Power BI service dashboard. With data visualization, you can get the best of a Power BI service account and manage your organization better. So, whether you are a small business or an MNC, Microsoft Power BI consulting service is crucial for enhancing your performance and customer satisfaction. This blog will discuss the ten benefits of data visualization through Power BI consulting.
Why Power BI is important for data visualization?
Data is the building block of any business. Imagine making a marketing strategy without data about user preferences or market trends. It is a waste of resources, especially finance. However, data alone can not help you with decision-making; understanding that data does. Power BI is a business intelligence app that allows users to collect, manage, and analyze data from diverse sources in one place.
Data visualization is one of the essential Power BI service features attracting millions of users. We are more likely to understand and remember visual information than a string of complex text and numbers. Thus, the Power BI service app lets users present their data in visually appealing graphs and charts. These charts could be customized live based on data sets associated with the chart. Therefore, you can see real-time performance and get real-time insights to make better decisions.
Data visualization has many benefits when working with a Power BI consulting firm. Let’s discuss more about it.
10 benefits of data visualization service!
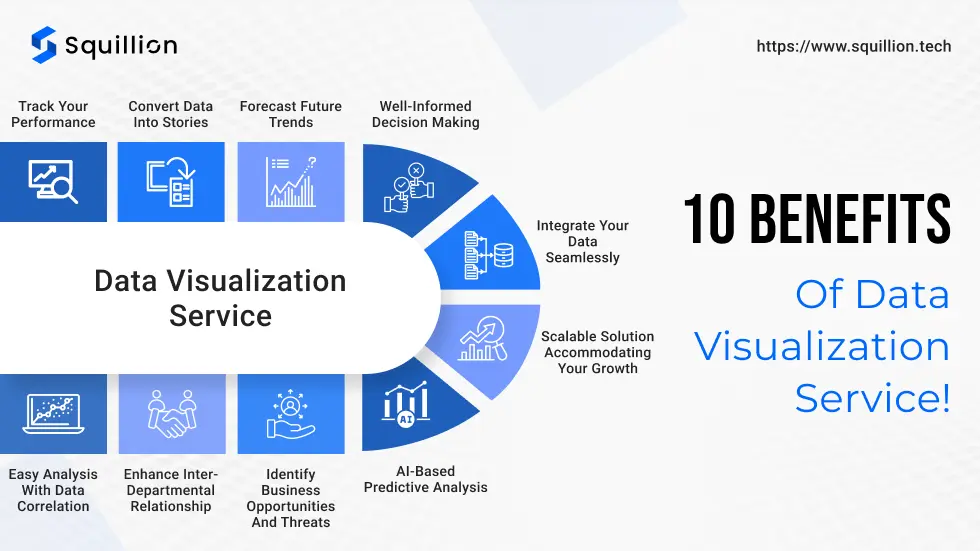
You can get the 10 benefits of data visualization by trusting a Power BI consulting company like Squillion Tech.
Track your performance
To enhance the profitability and efficiency of a company, you must understand the performance and the reason for hindrances if the performance expectations still need to be met. So, how do you track the performance of your teams and resources? Simply ask your teams from all the departments and offices to send your physical copies of the data. Analyze the data by compiling it and plotting it on a paper chart. Sounds ridiculous? Time-consuming? Is it a process with many possible errors? But that’s how things happened before Excel was released in 1985.
However, the internet and advanced tools have made tracking performance hassle-free and quick. Microsoft Power BI service makes collecting, compiling and analyzing data swift and straightforward. Therefore, companies like General Motors (GM) have chosen Power BI to manage their overseas brands and make strategic decisions to enhance operation and market performance.
Convert data into stories
Imagine you have to explain to your client how your marketing strategy has boosted sales in three consecutive quarters by stating numbers from Excel sheets. While they can understand what you are saying, it can be intimidating when bombarded with strings of numbers. Imagine a single-line graph showing the sales or any metric performance before and after implementing your marketing strategy. The line graph with two lines tells a story without you uttering a single work. That’s what data visualization does for you.
But we can create charts with any tool; what is the Power BI service used for? Most of the tool relies on the data you provide. You might need to update the data manually. It is time-consuming and prone to errors. However, with the Power BI service app, you can integrate diverse data sources in one place and update the data in one click. Therefore, you can create a real-time picture of the metrics and build interactive dashboards.
Forecast future trends
Power BI service allows the analysis of past data to create future trends for the departments and company. Power BI tools are designed to streamline the data analysis process and support the extraction of necessary data. It helps in the extraction and correlation of various metrics to determine the current and future trends.
Well-informed decision making
Decision-making skills often make or break the business. However, decision-making is crucial on the board and in the field. In the service or product industry, access to real-time data can help team members make better decisions to provide the best customer service. In a company, access to live insights helps build better strategies and get the best out of the market trends. Power BI service online enables company members to access data and dashboards from anywhere.
Heathrow Airport uses Power BI service features to manage their operations in the airport with 80 million travellers and 75000 staff members. So, live data related to flight schedules and tickets helps the staff members to offer tickets, cancellations, and other services to the passengers swiftly.
Integrate your data seamlessly
Data visualization depends on accurate data. That’s why Power BI is trusted to be the best data visualization tool. Power BI allows users to integrate diverse third-party data sources to extract data directly from the sources (like Google ads, excel sheets, and more). Therefore, the users get real-time data to enhance performance and analyze and create effective strategies.
For example, Humana, a US-based health insurance company, faced major customer and staff management problems. They have 47 data sources. Extracting necessary data from these sources hindered their pace and customer support. Therefore, using the Power BI service, they integrated all 47 data sources into one Power BI service account, leading to hassle-free data management and quick customer service.
Easy analysis with data correlation
Correlation of data has helped us understand our business better. It helps measure the impact of specific actions and the effectiveness of a strategy. Using advanced filters and data visualization tools in the Power BI service, you can create correlative dashboards to get better insights. Microsoft Power BI consulting service providers help you set up a system of data models to develop such valuable dashboards.
AI-based predictive analysis
AI has become a new normal in many industries and services. Power BI consulting service is no different. The Power BI consulting firm can help you project future trends with AI technology and predictive models. Thus, based on past performance and market trends, you can forecast future trends and market conditions to create and improvise strategies to get a competitive edge and secure high revenue.
With predictive technology, you can create interactive maps to outline possible outcomes of your plan and help you make a better decision. For example, Harley-Davidson uses predictive technology to identify high-value customers and build a relevant marketing strategy.
Identify business opportunities and threats
When you operate a business, there are equal amounts of opportunities and threats. Therefore, it becomes essential that you track your data skillfully to identify such indicators in the early stage. For example, by monitoring website or mobile users’ behaviour and conversion rates, you can identify potential threats or opportunities to grow a feature to enhance the user experience. With data visualization, understanding your users, competitors, and industry trends becomes better.
Enhance inter-departmental relationship
The organization primarily uses Microsoft Power BI service to streamline its data and operations. Therefore, one of the most valuable Power BI service features is the collaboration with another department. You can track project progress, track performance, and create and edit reports to ensure that all of you are on the same page and the data remains consistent in the data warehouse. Live dashboards can help the team keep track of the project and necessary information to deliver the best results.
Scalable solution accommodating your growth
One of the most crucial benefits of the Power BI consulting service is that it is designed to accommodate your needs. Therefore, the Power BI service is scalable to match the needs of your business. The data visualization tools, data integration, and other features change depending on project requirements. A Power BI consulting firm, like Squillion Tech, can help you build a scalable Power BI service account and operate it with ease.
Those were the ten benefits of using data visualization in Power BI services. However, to get the best of your Power BI licence, you can rely on a Power BI consulting company. Good news: we are here to help you with our Microsoft Power BI consulting service, which is trusted by many.
How can Squillion Tech help you with data visualization?

Squillion Tech is an expert Power BI consulting company that has a Microsoft partnership. Our team of Microsoft-certified developers are the brains offering seamless and quality Microsoft Power BI consulting. Clients from diverse countries have trusted our Power BI service online. Following are a few things you can expect from our Power BI consulting firm:
- Tailormade Power BI development plan that drives your results
- Industry-standard consultancy from Microsoft-certified Power BI developers
- Seamlessly integrate data from diverse sources in one place
- Secure the data with authority setup for data governance
- Provide necessary team training to access Power BI easily
- Reliable customer support to solve any of your doubts
So, if you want to upscale your business and make the right decision, start focusing on what your data says. We can help you with that with our customized Power BI solutions to help you be the better you and analyze your data better. Check out our website for more information.
Conclusion
Data is the most valuable asset for your organization. Whether it is scaling your business, expanding it, tracking performance, or forecasting future trends, data plays a vital role. However, data visualization helps you turn complex numbers into visually appealing visual stories through dashboards in Power BI service features. Data visualization enables you to track the performance of various metrics, forecast the future, predict consumer behaviour, and make better decision. A Power BI consulting firm like Squillin Tech can help you set up your Power BI service account through advanced integration, data modelling, and dashboard creation. We offer tailor-made Power BI solutions and train your team to help you streamline your operations and understand your data better. So, are you ready to enhance your performance and boost your growth? Our Power BI consulting service can help you drive the desired results. Check out our website to know more.